Showing posts with label personal. Show all posts

Monday, 20 June 2016

Day of Random Pi Stuff

Today's Pi Jobs:


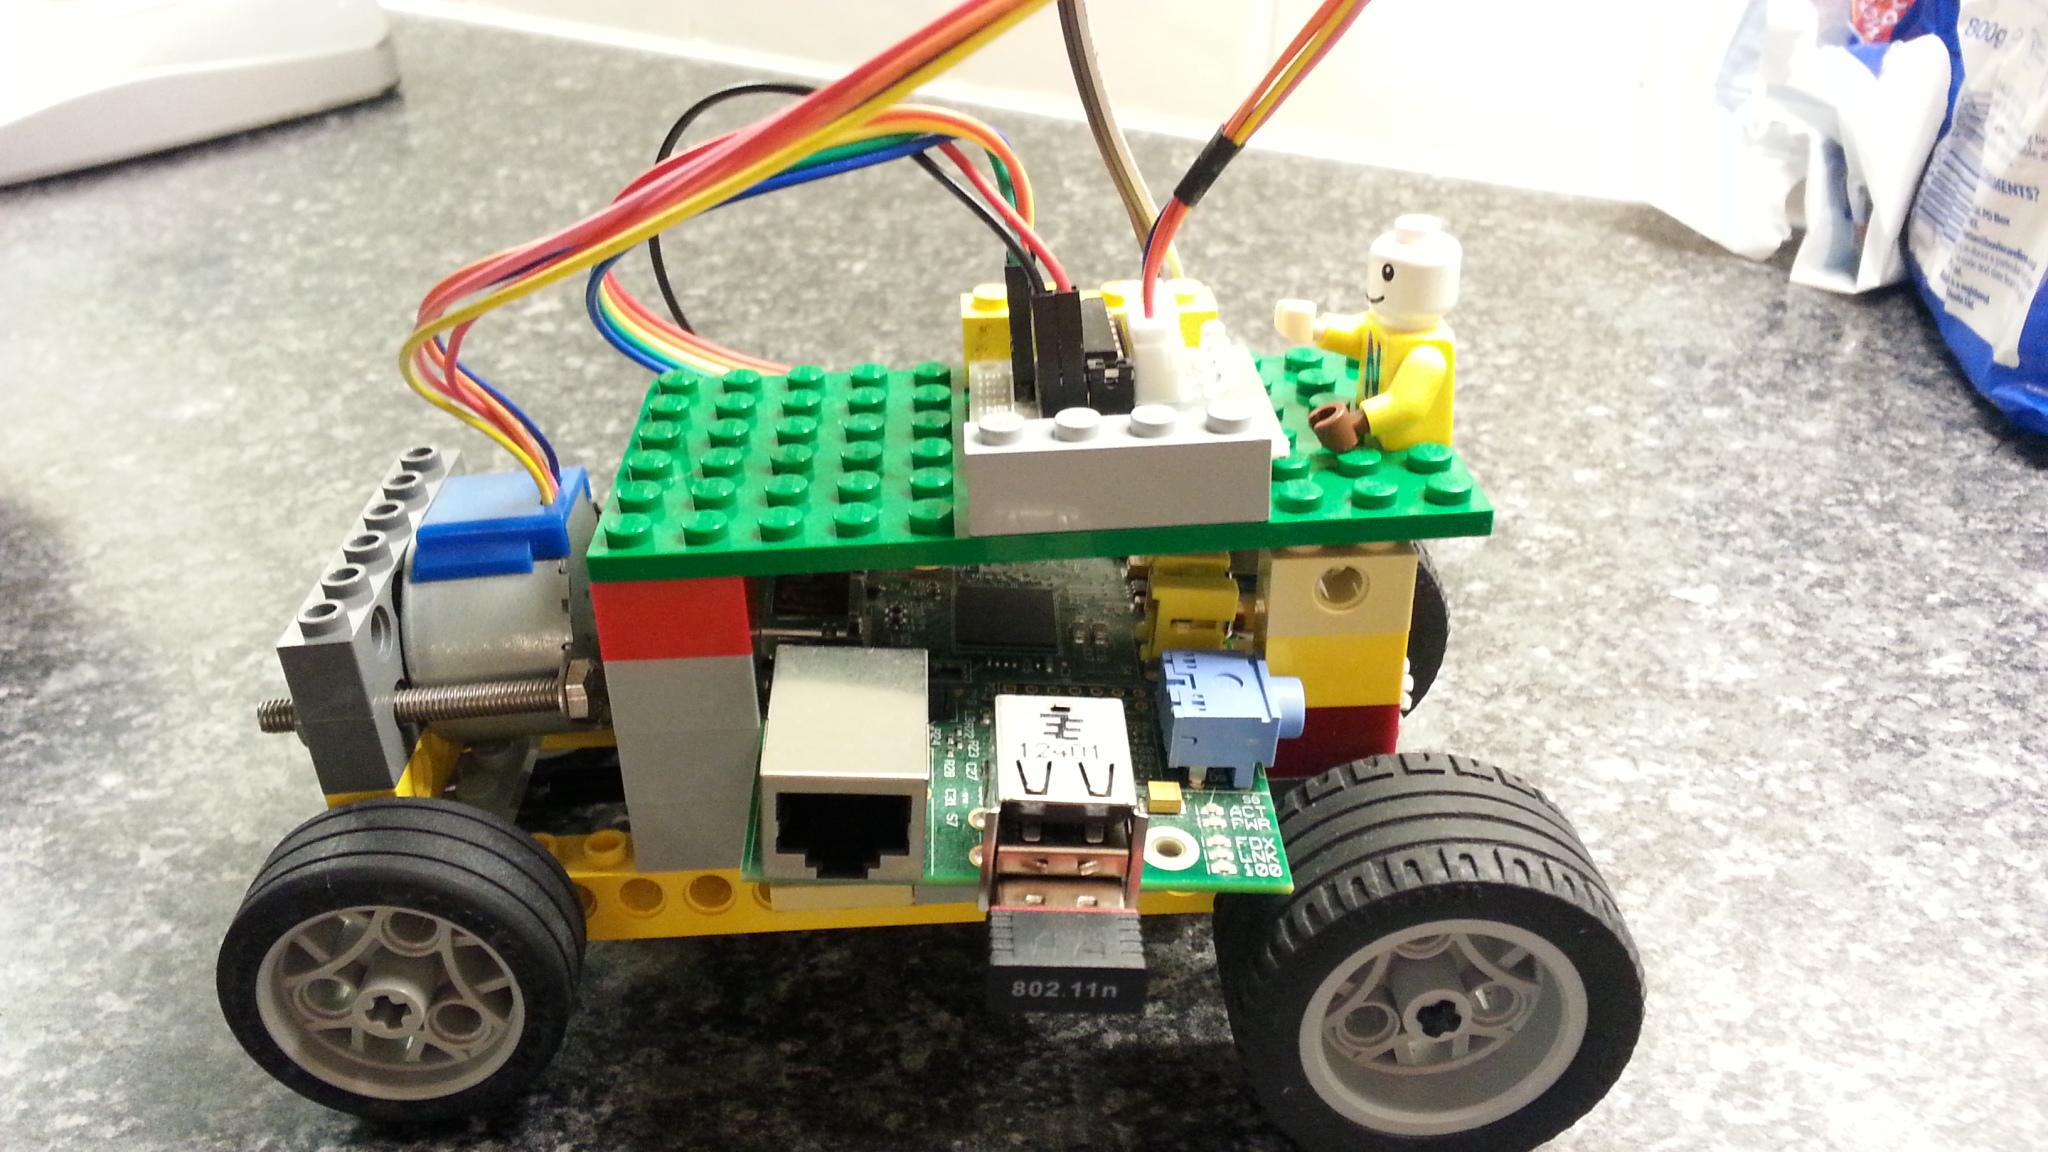
1) Prepare SD card for code club project so webcam can be fitted to the front of CamJam 3 robot. The kids have already built the bot and can remote control it via node-red. I used nginx for the first time with zero problems.

2) Reimage 4 new SD cards with latest Raspbian plus a few tweaks - pibrella and tightvncserver.

3) For home set up a camera on one pi that will send its pictures to another using a bash script and scp. The remote pi is feeding the pictures to the web.

I'll publish more details on these projects later.

Thursday, 21 April 2016

Sweet Peas

My wife planted some sweet peas and put them in the conservatory to get started.


I was sorting through my Pi bits and bobs and found the camera module and a project was born.

I made a camera rig from an old bit of wood and a section of bicycle brake cable and used a PoundWorld specs to get the focal length shorter*:


And found the code for the time lapse online here:

(https://picamera.readthedocs.org/en/release-1.10/recipes1.html#capturing-timelapse-sequences)

and only made slight amendments: https://github.com/jcwyatt/sweetpea2016/blob/master/sweetpea.py


After 11 days I copied the files across with scp and deleted all the files smaller than 150k (the dark night time pics) with this great command:

find . -name "*.jpg" -size -150k -delete

Then it was just a matter of using ffmpeg to make the images into a video. A quick search confirmed that it was possible to do this on filenames organised by dates:


ffmpeg -framerate 5 -pattern_type glob -i '*.jpg' -c:v libx264 -r 30 sweetpea01.mp4


5 images per second, 30fps video and it literally took a few seconds to create this:


All done headless and with the command line.

Saturday, 2 April 2016

Arduino - Acceleration Due to Gravity Testing Rig

I made the rig in the picture to measure acceleration due to gravity, just for fun.


The hardware is just a home made electromagnet powered through a ULN2003 (linking  2 channels to boost current). This was controlled using an Arduino Nano. I added an LED to indicate when the electromagnet was activated, and a button to activate it. The switch that detected the ball hitting the ground was also home made from a peg, some paperclips and tin foil:


The plan for the program was:


  • Push a button on the rig to activate the electromagnet for long enough to attach a bearing but not so long it burns out the hardware (4 seconds seemed about right)
  • Switch off the electromagnet automatically and simultaneously start a timer.
  • When the pressure switch is activated by the ball hitting the ground, stop the timer.
  • Work out the acceleration using a = 2s / t**2 
  • (s= distance fallen, t is the time)


I started the code in Ardublock because it avoids typing errors, but the calculations refused to give a valid result even when the timing was giving valid readings. After a frustrating hour of trying to fix it within Ardublock, 3 minutes with the actual code in the Arduino IDE had it working well. The erroneous values are when the ball missed the switch and I had to trigger it manually.


 The code:

https://github.com/jcwyatt/gravityfalls


Saturday, 27 February 2016

Hacking a ridiculously cheap laser.

I bought a couple of really cheap lasers off of eBay for a project I wanted to try at codeclub (Mission impossible style burglar detector using LDRs and lasers). They were about £1.50 each from China. Like this one but cheaper.

They were not easy to use in the chassis they came in, having a momentary push button switch, and eating batteries, so I set about taking one apart.

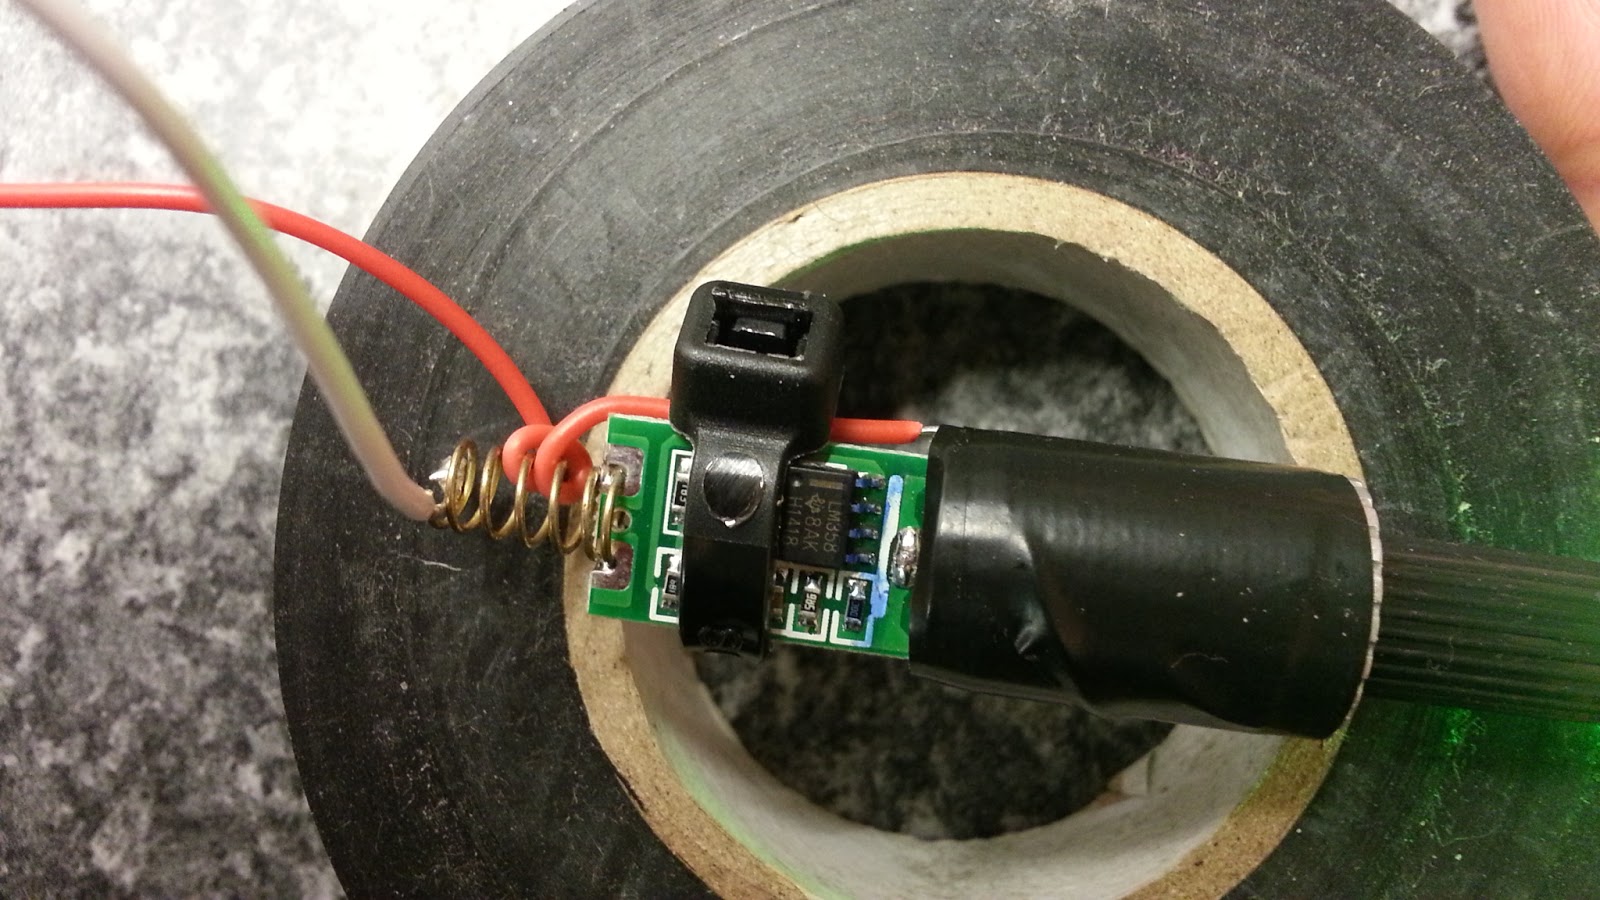
The chassis needed a bit of hacksaw work to split, and then the controlling chip and laser came out as one. I jammed on the switch with a cable tie, and taped the +ve wire to the body with insulating tape. The spring on the chip is the -ve:


Not quite sure of the power requirements but I think I would power it through a ULN2003 and an external battery supply if I was to include it in a project. Claims to be 1mW with 3V input. My multimeter read 25mA being supplied from the arduino 3.3V pin.

Not sure what project to include it in.

Robot Chassis - PoliceBot project

My son and I spent a bit of time this evening trying to get a robot chassis working.

My daughter and I built it a week or so ago:


This evening my son and I had a go at programming it to do something:


We used my new favourite programming tool - ardublock:


My son found some blue and white LEDs in my kit box, so we decided to make it into a police car.


It was really easy to get going.


I had a few problems with dodgy connections so we ended up soldering the power connections from the battery to the motors.

The next step is to activate the ultrasonic sensor on the front of the chassis.

Tuesday, 23 February 2016

Dodgy HC-SR04 Ultrasonic Distance Sensors

I've had a few issues trying get ultrasonic sensors working recently.

I'd had no problems previously when I'd used Flowol software to get one working with the boat project, so initially I suspected it was me trying to use Ardublock that was the problem, or just lack of skilled wiring on my part.

Turns out it was 4 dodgy HC-SR04 I'd bought through Amazon from China.

I built the circuit and tried the Newping sample sketch on one of the Amazon HC-SR04s. No reading on the serial monitor when using the Newping (well actually a continous zero reading)

I tried each of the sensors in turn, and as soon as I put an older SR04 I had lying around in the circuit, I immediately got good numbers in.

God to isolate the problem, but sucks to have to either return the parts or write them off and buy more.

At least knowing I had a good sensors let me try out the Ardublock program again, this time with some success, although it wouldn't read above 20cm.


Thursday, 14 January 2016

Tide Indicator Pi Project #9 - Calculation of Current Tide Completed (No bugs)

The last version I posted, v2.2, turned out not to work for all tide states, due to some maths errors. These have all been fixed and the code seems to work well.

I've think I've finally got the hang of updating to github, so here's the latest code:

tideproject/tidenow3.0.py

This is the output:

(datetime.datetime(2016, 1, 14, 21, 34, 13, 517280), u'10.5')
(datetime.datetime(2016, 1, 15, 4, 9, 13, 518325), u'1.9')
Tide is currently:  falling
Tidal Range =  -8.6
Current Tide :  9.55460304533


Next job is to have it running continuously and outputting to this webpage.

Sunday, 3 January 2016

Tide Indicator Pi Project #8 - Calculation of Current Tide Completed

The program below seems to work!

Output:

('Next: ', (datetime.datetime(2016, 1, 3, 6, 18, 23, 116073), u'4.3'), ' is ', datetime.timedelta(0, 21180, 2472), ' away. /n Previous: ', (datetime.datetime(2016, 1, 2, 23, 49, 23, 115191), u'8.1'), ' was ', datetime.timedelta(0, 2159, 998410), ' ago.')
('Sum of both gaps is ', datetime.timedelta(0, 23340, 882))
('Tide is Currently: ', 'falling')
('tide difference = ', -3.8)
('lower tide value', 4.299999999999999)
('Normalised Time =', 2159, 23340, 0.29060405051843885)
0.958070971113
('Current tide : ', 7.940669690228617)


Code:


#version 1.0
#This program pulls tide data from the ports of Jersey Website
#Under a licence from the UKHO
#
#It then calculates the current tide using a simplified sinusoidal harmonic approximation
#By finding the two tide data points either side of now and working out the current tide height


import urllib2
from bs4 import BeautifulSoup
from time import sleep
import datetime as dt
import math

#open site and grab html

rawhtml = urllib2.urlopen("http://www.ports.je/Pages/tides.aspx").read(40000)
soup = BeautifulSoup(rawhtml, "html.parser")


#get the tide data (it's all in tags)

rawtidedata = soup.findAll('td')


#parse all data points (date, times, heights) to one big list
#format of the list is [day,tm,ht,tm,ht,tm,lt,tm,lt]

n=0
parsedtidedata=[]
for i in rawtidedata: 
 parsedtidedata.append(rawtidedata[n].get_text())
 n += 1

#extract each class of data (day, time , height) to a separate list (there are 10 data items for each day)

tidetimes=[]
tideheights=[]
tideday=[]
lastdayofmonth=int(parsedtidedata[-10])

for n in range(0,lastdayofmonth*10,10):

 tideday.append(parsedtidedata[n])
 tidetimes.extend([parsedtidedata[n+1],parsedtidedata[n+3],parsedtidedata[n+5],parsedtidedata[n+7]])
 tideheights.extend([parsedtidedata[n+2],parsedtidedata[n+4],parsedtidedata[n+6],parsedtidedata[n+8]])

#get time now:

currentTime = dt.datetime.now()


#create a list of all the tide times as datetime objects:

dtTideTimes=[]
tideDataList=[]

for j in range (0,lastdayofmonth*4):
 #print tidetimes[j][0:2], tidetimes[j][3:6]
 if tidetimes[j]=='**':
  dtTideTimes.append('**')
 else:

  dtTideTimes.append(dt.datetime.now().replace(day=int(j/4+1), hour=int(tidetimes[j][0:2]), minute=int(tidetimes[j][3:5])))

 #make a tuple for each data point and add it to a list
 tupleHolder =(dtTideTimes[j], tideheights[j])
 tideDataList.append(tupleHolder)
 
 #print what we've got so far
# print tideDataList[j]

#find the two closest times in the list to now:

gap1 = abs(tideDataList[0][0] - currentTime)
gap2 = abs(tideDataList[0][0] - currentTime)
nearest1 = tideDataList[0]

#print gap1 

for j in range (0,lastdayofmonth*4):

 if (tideDataList[j][0] !="**"):                      
  gapx = abs(tideDataList[j][0] - currentTime) 

#check if the data point is the first or second nearest to now. 
#Generates the datapoints either side of now

  if (gapx <= gap1):                            
   nearest1 = tideDataList[j]            
   gap1 = gapx
  if (gap1 < gapx and gapx <= gap2): 
   nearest2 = tideDataList[j]                   
   gap2 = gapx             

#print (nearest1, gap1)
#print (nearest2, gap2)
#print (gap1+gap2)    

#and now the maths begins
#print ('tide height 1 = ', nearest1[1])
#print ('tide height 2 = ', nearest2[1])

#need to get them in order of time: (this works)

if nearest1[0] > nearest2[0]:
 nextDataPoint = nearest1
 prevDataPoint = nearest2
 gapToNext = gap1
 gapToPrev = gap2

else:
 nextDataPoint = nearest2
 prevDataPoint = nearest1
 gapToNext = gap2
 gapToPrev = gap1

gapSum = gapToNext + gapToPrev

print('Next: ', nextDataPoint,' is ',gapToNext, ' away. /n Previous: ', prevDataPoint, ' was ', gapToPrev, ' ago.')
print('Sum of both gaps is ', gapSum) #this works

#is the tide rising or falling?
tideDifference = float(nextDataPoint[1])-float(prevDataPoint[1])

if (tideDifference<0 data-blogger-escaped-0="prev" data-blogger-escaped-:="" data-blogger-escaped-all="" data-blogger-escaped-code="" data-blogger-escaped-currently:="" data-blogger-escaped-currenttide="" data-blogger-escaped-data="" data-blogger-escaped-difference=", tideDifference) #this works


lowerTide = (float(nearest1[1]) + float(nearest2[1]) - abs(tideDifference))/2
print (" data-blogger-escaped-doesn="" data-blogger-escaped-else:="" data-blogger-escaped-falling="" data-blogger-escaped-for="" data-blogger-escaped-ide="" data-blogger-escaped-is="" data-blogger-escaped-lower="" data-blogger-escaped-lowertide="" data-blogger-escaped-math.cos="" data-blogger-escaped-math.pi="" data-blogger-escaped-normalisedtime="" data-blogger-escaped-ormalised="" data-blogger-escaped-pi="next" data-blogger-escaped-print="" data-blogger-escaped-scaled="" data-blogger-escaped-t="" data-blogger-escaped-this="" data-blogger-escaped-tide="" data-blogger-escaped-tidedifference="" data-blogger-escaped-tidestate="" data-blogger-escaped-time=", gapToPrev.seconds, gapSum.seconds, normalisedTime)

print (math.cos(normalisedTime))

if tideState == " data-blogger-escaped-to="" data-blogger-escaped-urrent="" data-blogger-escaped-value="" data-blogger-escaped-work="" data-blogger-escaped-works="">

Saturday, 2 January 2016

Tide Indicator Pi Project #7 - Finding the two tide data points nearest to the current time.

This project is taking ages! I've done a lot since the last post however, but documented very little, so I'll do my best to recall how I got from there to here. You can see all the posts so far here.

The problem in a nutshell: The program needs to get the two tide data points either side of the current time, to work out what the tide is doing now.

Since the last post, the code has been modified to create a list of tuples, with each tuple having two data points (tide time, tide height)

It then works out the gap between each data point and the current time, and tries to store the two nearest times as 'nearest1' and 'nearest2'. Sometime it works:

Time Now:
2015-01-02 16:33

Output:
(datetime.datetime(2016, 1, 2, 17, 52, 40, 854958), u'4.0'),
(datetime.datetime(2016, 1, 2, 11, 9, 40, 854071), u'8.4')

Sometimes it doesn't and misses a point.


#
import urllib2
from bs4 import BeautifulSoup
from time import sleep
import datetime as dt


#open site and grab html

rawhtml = urllib2.urlopen("http://www.ports.je/Pages/tides.aspx").read(40000)
soup = BeautifulSoup(rawhtml, "html.parser")


#get the tide data (it's all in tags)

rawtidedata = soup.findAll('td')


#parse all data points (date, times, heights) to one big list
#format of the list is [day,tm,ht,tm,ht,tm,lt,tm,lt]

n=0
parsedtidedata=[]
for i in rawtidedata: 
 parsedtidedata.append(rawtidedata[n].get_text())
 n += 1

#extract each class of data (day, time , height) to a separate list (there are 10 data items for each day):

tidetimes=[]
tideheights=[]
tideday=[]
lastdayofmonth=int(parsedtidedata[-10])

for n in range(0,lastdayofmonth*10,10):

 tideday.append(parsedtidedata[n])
 tidetimes.extend([parsedtidedata[n+1],parsedtidedata[n+3],parsedtidedata[n+5],parsedtidedata[n+7]])
 tideheights.extend([parsedtidedata[n+2],parsedtidedata[n+4],parsedtidedata[n+6],parsedtidedata[n+8]])

#get time now:

currentTime = dt.datetime.now()


#create a list of all the tide times as datetime objects:

dtTideTimes=[]
tideDataList=[]

for j in range (0,lastdayofmonth*4):
 #print tidetimes[j][0:2], tidetimes[j][3:6]
 if tidetimes[j]=='**':
  dtTideTimes.append('**')
 else:
  dtTideTimes.append(dt.datetime.now().replace(day=int(j/4+1), hour=int(tidetimes[j][0:2]), minute=int(tidetimes[j][3:5])))


#create a tuple of time and height, and add each tuple to a list


 tupleHolder =(dtTideTimes[j], tideheights[j])
 tideDataList.append(tupleHolder)


#print what we've got so far


for j in range (0,lastdayofmonth*4):
 print tideDataList[j]

#find the two closest data points to now in the list:

gap1 = abs(tideDataList[0][0] - currentTime)
nearest1 = tideDataList[0]
print gap1 

for j in range (0,lastdayofmonth*4):


 if (tideDataList[j][0] !="**"):


  gap2 = abs(tideDataList[j][0] - currentTime)
  print tideDataList[j][0], gap2, nearest1


  if (gap2 < gap1):


   nearest2 = nearest1
   nearest1 = tideDataList[j]
   gap1 = gap2

print (nearest1, nearest2)
    
#this nearly works!!! Gave the two nearest high tides, not nearest high and low.

Thursday, 31 December 2015

Home Heating IoT Project - MQTT? Node.js? Both? - Initial Thoughts

This is the plan:


In my house, I have 4 Redwell heaters in upstairs rooms. They were installed inexpertly (not by me) with the receiver/relay units downstairs, so the room thermostat's RF send signal is not always picked up. This results in heaters staying on all day sometimes.

An IoT solution would solve this problem as well as giving me a host of other useful features. Most desirable:


  • Programmable on/off times (very desirable option: with thermostat control)
  • Manual on/off override of timing program.
  • All on / all off override for if we are out on an evening.
  • Webpage interface.
  • Internet access from outside the home.
From what I have read so far, it looks like MQTT could be very useful, as could node.js. (see also here)

First step is to build a mini-mock-up. On current form this will take months!


Monday, 21 December 2015

MQTT - Mosquitto - To control IoT stuff

I'm coming to realise that MQTT is probably the tool I need to get my head around for basic home automation / monitoring.

On reading up a bit here:


I saw a link to Andy Standford-Clarks ' House that Twitters':


with the audio from the talk at oggcamp here:
http://stanford-clark.com/andysc_oggcamp.mp3


 Less Technical talk by ASC:


Things I want to check out further:
Easyradio
X10 appliance control signalling via mains cables: http://www.x10.com/

Also useful:
http://oliversmith.io/technology/2010/02/26/mqtt-mosquitto-and-php/
(And lots of other stuff from @chemicaloliver )

Idea: AIS - Ship-plotter - Condor??

Further research needed: Websockets.


Monday, 14 December 2015

Wearable Tech - Daughter's Christmas Jumper


Daughter #1 needed to jazz up her Christmas jumper for school. We had a cheap set of 50 blue LED lights with 3xAA battery pack attached, and she was going to use them as they were.

Itching to use my Arduino Nano I'd acquired a couple of months previously, I suggested an upgrade!

Fastening the lights to the jumper was the hardest bit.


I used this code to program the lights:


// Dim an LED using a PWM pin
int PWMpin = 10; // LED in series with 470 ohm resistor on pin 10

void setup()
{
  // no setup needed
}

void loop()
{
   for (int i=0; i <= 255; i++){
      analogWrite(PWMpin, i);
      delay(15);
   }

   for (int i=0; i <= 3; i++){
     analogWrite(PWMpin, 255);
     delay(500);
     analogWrite(PWMpin, 0);
     delay(500);
   }
   for (int i=0; i <= 10; i++){
     analogWrite(PWMpin, 255);
     delay(100);
     analogWrite(PWMpin, 0);
     delay(100);
   }


   for (int i=0; i <= 255; i++){
      analogWrite(PWMpin, 0-i);
      delay(15);
   } 
}


Tuesday, 1 December 2015

Arduino Autonomous Boat

This is what I built for the 2015  Jersey Tech Fair:


When discussing the Tech Fair, and the probability of there being a large pool for the open ROV (link), my colleague, Max, suggested some surface craft, to make further use of the pool. Intrigued, I volunteered to make one too, thinking it would be a relatively simple thing to do with a Raspberry Pi.

Instead it turned into a great learning experience with the Arduino platform. I LOVE the Arduino now, almost as much as the Pi! I was looking for an excuse to try programming the Arduino with Flowol, which I use in schools with children for my day-job . This proved the perfect project.


Build Stage 1:

Planning:

Build Stage 2:


Completed Build: 


Having used Flowol extensively in schools with children, and knowing it could program the Arduino, it seemed a quick win to use it for this project. I could refresh my 'C' language skills another time.


Failures:

Bluetooth Remote Control - could not get this to work. Still haven't. Tried various bits of code and apps.

Camera Module - just ran out of time to make it a 'glass-bottomed boat' with a Pi and camera module included. Mark 2 will have!

Design:

Air propulsion was decided upon early. Initially we'd discussed using battery powered pocket cooling fans. In the end we went for motors with propellers attached. All three boats use different steering mechanisms. Mine uses a traditional rudder. Max went for a pair of motors on one model and a pivoting motor on the second.

Materials:

I used expanded polystyrene wrapped in black duct tape. Max went for Kingspan insulation, which I would go for next time. It's stiffer, easier to source, and nicer to work with and shape. The electronics are in modular form with each section in a business card box, to try and keep it dry. The motors and prop were from a school DT cupboard. I ordered the battery pack online.

Problems:

Biggest problem - noise on the ultrasonic sensors, caused by either the motor or the servo. I partially solved it by averaging three readings. Still too erratic though.

I recorded this while I investigated the noise problem with an oscilloscope at work.


The other main problem, which was actually of little import in the end, was that after the first test in Coronation Park, I must have damaged my Arduino board, as I could no longer connect to reprogram it. However, it ran the existing program perfectly, and since it worked, there was no real need to change it. I turned the prop round to a 'pull' rather than a push, but I just swapped the wires so no reprogramming was necessary.


Thursday, 15 October 2015

Tide Indicator Pi Project #6 - Converting tide times to datetime format

Crikey..that was tricky.

Ended up that the best way was to take year and month info from the datetime.now() and just replace the day, hour and time for each tide time data point. Output for

print dtTideTimes[j], tideheights[j]


looks like this:

2015-10-01 09:21:22.975449 11.7
2015-10-01 21:42:22.976826 11.5
2015-10-01 03:48:22.977813 0.6
2015-10-01 16:07:22.978737 0.9
2015-10-02 10:00:22.979654 11.1
2015-10-02 22:23:22.980587 10.6
2015-10-02 04:27:22.981501 1.1
2015-10-02 16:47:22.982419 1.5
2015-10-03 10:37:22.983506 10.2
2015-10-03 23:03:22.984480 9.6
2015-10-03 05:06:22.985411 1.9
2015-10-03 17:27:22.986337 2.4
etc

Problem now is that this is not sorted in strict time order. It is in the format HT, HT, LT, LT for each day. I created a dictionary thinking it would be easy to sort, but it's not.

I think I have a plan though, to find the two data points in the dictionary nearest to the current time.


import urllib2
from bs4 import BeautifulSoup
from time import sleep
import datetime as dt


#open site and grab html

rawhtml = urllib2.urlopen("http://www.ports.je/Pages/tides.aspx").read(40000)
soup = BeautifulSoup(rawhtml, "html.parser")


#get the tide data (it's all in tags)

rawtidedata = soup.findAll('td')


#parse all data points (date, times, heights) to one big list
#format of the list is [day,tm,ht,tm,ht,tm,lt,tm,lt]

n=0
parsedtidedata=[]
for i in rawtidedata: 
 parsedtidedata.append(rawtidedata[n].get_text())
 n += 1

#extract each class of data (day, time , height) to a separate list (there are 10 data items for each day)

tidetimes=[]
tideheights=[]
tideday=[]
lastdayofmonth=int(parsedtidedata[-10])

for n in range(0,lastdayofmonth*10,10):

 tideday.append(parsedtidedata[n])
 tidetimes.extend([parsedtidedata[n+1],parsedtidedata[n+3],parsedtidedata[n+5],parsedtidedata[n+7]])
 tideheights.extend([parsedtidedata[n+2],parsedtidedata[n+4],parsedtidedata[n+6],parsedtidedata[n+8]])

#get time now:

currentTime = dt.datetime.now()


#create a list of all the tide times as datetime objects:

dtTideTimes=[]

for j in range (0,lastdayofmonth*4):
 #print tidetimes[j][0:2], tidetimes[j][3:6]
 if tidetimes[j]=='**':
  dtTideTimes.append('**')
 else:
  dtTideTimes.append(dt.datetime.now().replace(day=int(j/4+1), hour=int(tidetimes[j][0:2]), minute=int(tidetimes[j][3:5])))
 print dtTideTimes[j], tideheights[j]
 
#create a dictionary linking dtTideTimes:tideheights

tidedatadict={}

for k in range (0,lastdayofmonth*4):
 tidedatadict[dtTideTimes[k]]=tideheights[k]


Friday, 9 October 2015

Son of Thermobot - Mk2 Lives!


It's nearly time for the first Jersey Raspberry Jam and I'm taking along Thermobot. Thermobot Mk1 was taken apart for other projects so it was time to rebuild.

We have 3 HUGE tubs of lego, so it was pretty easy to source enough bits for a much better chassis:


check out the bolted stepper motor!
Then add the pi, thermometer and stepper controller board:


It took several goes and a nasty burning smell before I finally got all the wires in the right places, which is why I drew the above, so it's easier next time.

The code is the same as before. Except that I haven't bothered to get it to graph the data this time.

With the new gearing, the robot moves 6 cm per rotation, so 3 cm per °C


Monday, 5 October 2015

Tide Indicator Pi Project #5 - Parsing a months worth of tide data into different lists

Today I learned to use 

list.extend([item[1],item[2]])

to split the parsed tide data to different lists. :-)

full code below.


#A python program to import tide data from a portsofjersey website
#tidenow.py
#It pulls the data in from the tide site, a month at a time
#It looks for the class headers associated with date,time and height information
#and then creates lists of these data


import urllib2
from bs4 import BeautifulSoup
from time import sleep
import datetime as dt


#open site and grab html

rawhtml = urllib2.urlopen("http://www.ports.je/Pages/tides.aspx").read(40000)
soup = BeautifulSoup(rawhtml, "html.parser")


#get the tide data (it's all in 'td' tags)

rawtidedata = soup.findAll('td')


#get just the month and year (it's in the 1st 'h2' tag on the page)

rawmonthyear = soup.findAll('h2')[0].get_text()
print ('Month and Year: ', rawmonthyear)

#strip the html and parse it all to one big list

n=0
parsedtidedata=[]
for i in rawtidedata: 
   parsedtidedata.append(rawtidedata[n].get_text())
 # print (parsedtidedata[n]) #leave in for debugging for now
   n += 1


#create lists for each class of data

tidetimes=[]
tideheights=[]
tideday=[]


#extract data to each list (there are 10 data items for each day)

lastdayofmonth=int(parsedtidedata[-10])

for n in range(0,lastdayofmonth*10,10):

   tideday.append(parsedtidedata[n])
   tidetimes.extend([parsedtidedata[n+1],parsedtidedata[n+3],parsedtidedata[n+5],parsedtidedata[n+7]])
   tideheights.extend([parsedtidedata[n+2],parsedtidedata[n+4],parsedtidedata[n+6],parsedtidedata[n+8]])

print('data for the 1st of the month')
n=0
print tideday[n]
print tidetimes[n:n+4]
print tideheights[n:n+4] 

Sunday, 4 October 2015

Tide Indicator Pi Project #4 - Scraping a months worth of tide data in one hit

Having realised in my previous post I needed to move away from daily tide processing to collecting as data for a longer period, I chose this site to gather from, as the html code looked easy to scrape.

The code below is a starting point. I collects a month's worth of tide data, and parses it to one long list. I like this data better than the last site because 'empty' data slots are filled with '***' as a useful place-holder. The output is shown below.


#A python program to import tide data from a Ports of Jersey website
#tidenow.py
#It pulls the data in from the tide site, a month at a time

#import tweepy
#import smtplib
import urllib2
#import re
from bs4 import BeautifulSoup
from time import sleep
import datetime as dt


#open site and grab html

rawhtml = urllib2.urlopen("http://www.ports.je/Pages/tides.aspx").read(40000)
soup = BeautifulSoup(rawhtml, "html.parser")


#get the tide data (it's all in 'td'tags)

rawtidedata = soup.findAll('td')


#get just the month and year (it's in the 1st h2 tag on the page)

rawmonthyear = soup.findAll('h2')[0].get_text()
print ('Month and Year: ', rawmonthyear)

#parse it all to a list
n=0
parsedtidedata=[]
for i in rawtidedata: 
 parsedtidedata.append(rawtidedata[n].get_text())
 print (parsedtidedata[n])
 n += 1


Output:


Thursday, 1 October 2015

Tide Indicator Pi Project #3 - Success! and Complete Rethink Required

The next step in my plan to collect tide data from the web and use it to make some kind of live tide gauge.

Darn it, I thought I had it:


#tides for #jerseyci today, Thursday 1 October:
03:48 0.6m
09:21 11.7m
16:07 0.9m
21:42 11.5m
data from http://mbcurl.me/13KDW

I've been successfully scraping daily tide data, and posting it on my Pi-hosted site here...

jcwyatt.ddns.net

and tweeting it here...

www.twitter.com/#jerseyci

which was a major goal (code is below). Chron runs this Python program every morning at 5:30am.

However now it has come to thinking about calculating live tide heights I've hit a wall when trying to use the data I'm currently scraping.

I've been working on daily data, when what is needed is continuous data over a longer time. Once I have that I think I can calculate live tide height with a rolling algorithm. Tides don't fit in neat daily chunks.

I'm going back to here: http://www.ports.je/Pages/tides.aspx to scrape a month's worth of data at a time and see how it goes.

The code below took a while and is pretty untidy, but it does what it needs to do, with some nifty string and list handling that I'm quite proud of. 


#A python program to import tide data from a gov.je website
#tidescrape6.0.py - working fine
#It pulls the data in from the gov.je tide site, which is updated daily
#It looks for the class headers associated with date,time and height information
#and then creates a list of these bits of html

#this version(6.0) is called by a chrontab function and tweets at 5:30am everyday.

import tweepy
import smtplib
import urllib2
import re
from bs4 import BeautifulSoup
from time import sleep
import datetime as dt


#function to scrape tide data from website
def tidedatascrape():

 #open site
 rawhtml = urllib2.urlopen("http://www.gov.je/Weather/Pages/Tides.aspx").read(20000)

 soup = BeautifulSoup(rawhtml)

 #from http://stackoverflow.com/questions/14257717/python-beautifulsoup-wildcard-attribute-id-search

 #get the dates:
 tidedates = soup.findAll('td', {'class': re.compile('TidesDate.*')} )
 #get the times:
 tidetimes = soup.findAll('td', {'class': re.compile('TidesTime.*')} )
 #get the heights:
 tideheights = soup.findAll('td', {'class': re.compile('TidesHeight.*')} )

 #collect together the data for today

 todaysdate = tidedates[0].get_text()
 print (todaysdate)
 todaystimes = tidetimes[0].get_text()
 print (todaystimes)
 todaysheights = tideheights[0].get_text()
 print (todaysheights)


 #parse the times (always a 5 character string)
 ttime = [0,0,0,0]
 for i in range (0,4):
  ttime[i]=todaystimes[5*i:(5*i+5)]
  print ttime[i]


 #parse the heights (3 or 4 ch string delimited by 'm' e.g 2.5m3.4m etc)
 theight = ['','','','']
 list_index = 0
 for i in todaysheights:
  if i == 'm':
   list_index += 1
  else:
   theight[list_index] = theight[list_index] + i
 print theight[0]


 #create a tweetable string of all the data
 tweetstring = ('#tides for #jerseyci today, ' + todaysdate + ':\n')
 for i in range (0,4):
  tweetstring = tweetstring + (ttime[i] + ' ' + theight[i] + 'm\n')
 tweetstring = tweetstring + 'data from http://mbcurl.me/13KDW'
 print tweetstring
 return tweetstring
 

 #print len(tweetstring) #just to check it is within 140 characters

#function to write to a text file
def writetidestofile(tweetstring):
        with open('/var/www/dailytideoutput.txt','w') as f:
                f.write(str(tweetstring))
                f.close()


#function to tweet it
def tweettidedata(tweetstring):
 CONSUMER_KEY = '0000000000000000000'#keep the quotes, replace this with your consumer key
 CONSUMER_SECRET = '00000000000000000000000000000000000000'#keep the quotes, replace this with your consumer secret key
 ACCESS_KEY = '00000000000000000000000000000000000000'#keep the quotes, replace this with your access token
 ACCESS_SECRET = '00000000000000000000000000000000000000'#keep the quotes, replace this with your access token secret
 auth = tweepy.OAuthHandler(CONSUMER_KEY, CONSUMER_SECRET)
 auth.set_access_token(ACCESS_KEY, ACCESS_SECRET)
 api = tweepy.API(auth)

 api.update_status(status=tweetstring) #THIS LINE TWEETS! - LEAVE DEACTIVATED UNTIL READY


#email it(commented out for now)
'''
fromaddr = 'jbloggs@gmail.com'
toaddr  = 'j.bloggette@free.sch.uk'

# Credentials (if needed)
username = raw_input('gmail un: ')
password = raw_input('gmail pw: ')

# The actual mail send
server = smtplib.SMTP('smtp.gmail.com:587')
server.ehlo()
server.starttls()
server.login(username,password)
headers = "\r\n".join(["from: " + fromaddr,
                       "subject: " + 'Tides Today',
                       "to: " + toaddr,
                       "mime-version: 1.0",
                       "cont#ent-type: text/html"])

# body_of_email can be plaintext or html!                    
content = headers + "\r\n\r\n" + tweetstring
server.sendmail(fromaddr, toaddr, content)
server.quit
'''

#main prog
#collect data
tweetstring = tidedatascrape()
#output to file
writetidestofile(tweetstring)
#tweet data
tweettidedata(tweetstring) 


Sunday, 9 August 2015

Tide Indicator Pi Project #2 - Scraping the tidal data for St Helier

Tide Indicator Pi Project #2 - Scraping the tidal data for St Helier

Have working code that extracts the code and makes lists from it (with the html tags still attached for now):

#A python program to import tide data from a gov.je website
#tidescrape1.0.py - working fine
#It pulls the data in from the gov.je tide site, wkhich is updated daily
#It looks for the class headers associated with date,time and height information
#and then creates a list of these bits of html

#next step - try to extract just the data from current day and tweet it.

import urllib2
import re
from bs4 import BeautifulSoup


#open site
rawhtml = urllib2.urlopen("http://www.gov.je/Weather/Pages/Tides.aspx").read(20000)

soup = BeautifulSoup(rawhtml)

#from http://stackoverflow.com/questions/14257717/python-beautifulsoup-wildcard-attribute-id-search
#get the dates:
tidedates = soup.findAll('td', {'class': re.compile('TidesDate.*')} )

print (tidedates[0])

#get the times:
tidetimes = soup.findAll('td', {'class': re.compile('TidesTime.*')} )

print (tidetimes[0])

#get the heights:
tideheights = soup.findAll('td', {'class': re.compile('TidesHeight.*')} )

print (tideheights[0])

Output looks like this:

<td class="TidesDate Weekend">Sunday 9 August</td>
<td class="TidesTime Weekend"><span style="color:#cc0000;">01:57</span><br/>08:42<br/>14:33<br/>21:27<br/></td>
<td class="TidesHeight Weekend"><span style="color:#cc0000;">8.5m</span><br/>3.6m<br/>8.4m<br/>3.7m<br/></td>


Next step is to somehow strip the text out.

Monday, 27 July 2015

Tide Indicator Pi Project #1 - Scraping the tidal data for St Helier - Update

A quick update to post 1 on this project.

This is the data from the Jerseymet site and it looks like it is indexed well and the required data sits in nice blocks.