Thursday, 31 December 2015

Home Heating IoT Project - MQTT? Node.js? Both? - Initial Thoughts

This is the plan:


In my house, I have 4 Redwell heaters in upstairs rooms. They were installed inexpertly (not by me) with the receiver/relay units downstairs, so the room thermostat's RF send signal is not always picked up. This results in heaters staying on all day sometimes.

An IoT solution would solve this problem as well as giving me a host of other useful features. Most desirable:


  • Programmable on/off times (very desirable option: with thermostat control)
  • Manual on/off override of timing program.
  • All on / all off override for if we are out on an evening.
  • Webpage interface.
  • Internet access from outside the home.
From what I have read so far, it looks like MQTT could be very useful, as could node.js. (see also here)

First step is to build a mini-mock-up. On current form this will take months!


Monday, 21 December 2015

MQTT - Mosquitto - To control IoT stuff

I'm coming to realise that MQTT is probably the tool I need to get my head around for basic home automation / monitoring.

On reading up a bit here:


I saw a link to Andy Standford-Clarks ' House that Twitters':


with the audio from the talk at oggcamp here:
http://stanford-clark.com/andysc_oggcamp.mp3


 Less Technical talk by ASC:


Things I want to check out further:
Easyradio
X10 appliance control signalling via mains cables: http://www.x10.com/

Also useful:
http://oliversmith.io/technology/2010/02/26/mqtt-mosquitto-and-php/
(And lots of other stuff from @chemicaloliver )

Idea: AIS - Ship-plotter - Condor??

Further research needed: Websockets.


Monday, 14 December 2015

Wearable Tech - Daughter's Christmas Jumper


Daughter #1 needed to jazz up her Christmas jumper for school. We had a cheap set of 50 blue LED lights with 3xAA battery pack attached, and she was going to use them as they were.

Itching to use my Arduino Nano I'd acquired a couple of months previously, I suggested an upgrade!

Fastening the lights to the jumper was the hardest bit.


I used this code to program the lights:


// Dim an LED using a PWM pin
int PWMpin = 10; // LED in series with 470 ohm resistor on pin 10

void setup()
{
  // no setup needed
}

void loop()
{
   for (int i=0; i <= 255; i++){
      analogWrite(PWMpin, i);
      delay(15);
   }

   for (int i=0; i <= 3; i++){
     analogWrite(PWMpin, 255);
     delay(500);
     analogWrite(PWMpin, 0);
     delay(500);
   }
   for (int i=0; i <= 10; i++){
     analogWrite(PWMpin, 255);
     delay(100);
     analogWrite(PWMpin, 0);
     delay(100);
   }


   for (int i=0; i <= 255; i++){
      analogWrite(PWMpin, 0-i);
      delay(15);
   } 
}


Tuesday, 1 December 2015

Arduino Autonomous Boat

This is what I built for the 2015  Jersey Tech Fair:


When discussing the Tech Fair, and the probability of there being a large pool for the open ROV (link), my colleague, Max, suggested some surface craft, to make further use of the pool. Intrigued, I volunteered to make one too, thinking it would be a relatively simple thing to do with a Raspberry Pi.

Instead it turned into a great learning experience with the Arduino platform. I LOVE the Arduino now, almost as much as the Pi! I was looking for an excuse to try programming the Arduino with Flowol, which I use in schools with children for my day-job . This proved the perfect project.


Build Stage 1:

Planning:

Build Stage 2:


Completed Build: 


Having used Flowol extensively in schools with children, and knowing it could program the Arduino, it seemed a quick win to use it for this project. I could refresh my 'C' language skills another time.


Failures:

Bluetooth Remote Control - could not get this to work. Still haven't. Tried various bits of code and apps.

Camera Module - just ran out of time to make it a 'glass-bottomed boat' with a Pi and camera module included. Mark 2 will have!

Design:

Air propulsion was decided upon early. Initially we'd discussed using battery powered pocket cooling fans. In the end we went for motors with propellers attached. All three boats use different steering mechanisms. Mine uses a traditional rudder. Max went for a pair of motors on one model and a pivoting motor on the second.

Materials:

I used expanded polystyrene wrapped in black duct tape. Max went for Kingspan insulation, which I would go for next time. It's stiffer, easier to source, and nicer to work with and shape. The electronics are in modular form with each section in a business card box, to try and keep it dry. The motors and prop were from a school DT cupboard. I ordered the battery pack online.

Problems:

Biggest problem - noise on the ultrasonic sensors, caused by either the motor or the servo. I partially solved it by averaging three readings. Still too erratic though.

I recorded this while I investigated the noise problem with an oscilloscope at work.


The other main problem, which was actually of little import in the end, was that after the first test in Coronation Park, I must have damaged my Arduino board, as I could no longer connect to reprogram it. However, it ran the existing program perfectly, and since it worked, there was no real need to change it. I turned the prop round to a 'pull' rather than a push, but I just swapped the wires so no reprogramming was necessary.


Thursday, 15 October 2015

Tide Indicator Pi Project #6 - Converting tide times to datetime format

Crikey..that was tricky.

Ended up that the best way was to take year and month info from the datetime.now() and just replace the day, hour and time for each tide time data point. Output for

print dtTideTimes[j], tideheights[j]


looks like this:

2015-10-01 09:21:22.975449 11.7
2015-10-01 21:42:22.976826 11.5
2015-10-01 03:48:22.977813 0.6
2015-10-01 16:07:22.978737 0.9
2015-10-02 10:00:22.979654 11.1
2015-10-02 22:23:22.980587 10.6
2015-10-02 04:27:22.981501 1.1
2015-10-02 16:47:22.982419 1.5
2015-10-03 10:37:22.983506 10.2
2015-10-03 23:03:22.984480 9.6
2015-10-03 05:06:22.985411 1.9
2015-10-03 17:27:22.986337 2.4
etc

Problem now is that this is not sorted in strict time order. It is in the format HT, HT, LT, LT for each day. I created a dictionary thinking it would be easy to sort, but it's not.

I think I have a plan though, to find the two data points in the dictionary nearest to the current time.


import urllib2
from bs4 import BeautifulSoup
from time import sleep
import datetime as dt


#open site and grab html

rawhtml = urllib2.urlopen("http://www.ports.je/Pages/tides.aspx").read(40000)
soup = BeautifulSoup(rawhtml, "html.parser")


#get the tide data (it's all in tags)

rawtidedata = soup.findAll('td')


#parse all data points (date, times, heights) to one big list
#format of the list is [day,tm,ht,tm,ht,tm,lt,tm,lt]

n=0
parsedtidedata=[]
for i in rawtidedata: 
 parsedtidedata.append(rawtidedata[n].get_text())
 n += 1

#extract each class of data (day, time , height) to a separate list (there are 10 data items for each day)

tidetimes=[]
tideheights=[]
tideday=[]
lastdayofmonth=int(parsedtidedata[-10])

for n in range(0,lastdayofmonth*10,10):

 tideday.append(parsedtidedata[n])
 tidetimes.extend([parsedtidedata[n+1],parsedtidedata[n+3],parsedtidedata[n+5],parsedtidedata[n+7]])
 tideheights.extend([parsedtidedata[n+2],parsedtidedata[n+4],parsedtidedata[n+6],parsedtidedata[n+8]])

#get time now:

currentTime = dt.datetime.now()


#create a list of all the tide times as datetime objects:

dtTideTimes=[]

for j in range (0,lastdayofmonth*4):
 #print tidetimes[j][0:2], tidetimes[j][3:6]
 if tidetimes[j]=='**':
  dtTideTimes.append('**')
 else:
  dtTideTimes.append(dt.datetime.now().replace(day=int(j/4+1), hour=int(tidetimes[j][0:2]), minute=int(tidetimes[j][3:5])))
 print dtTideTimes[j], tideheights[j]
 
#create a dictionary linking dtTideTimes:tideheights

tidedatadict={}

for k in range (0,lastdayofmonth*4):
 tidedatadict[dtTideTimes[k]]=tideheights[k]


Friday, 9 October 2015

Son of Thermobot - Mk2 Lives!


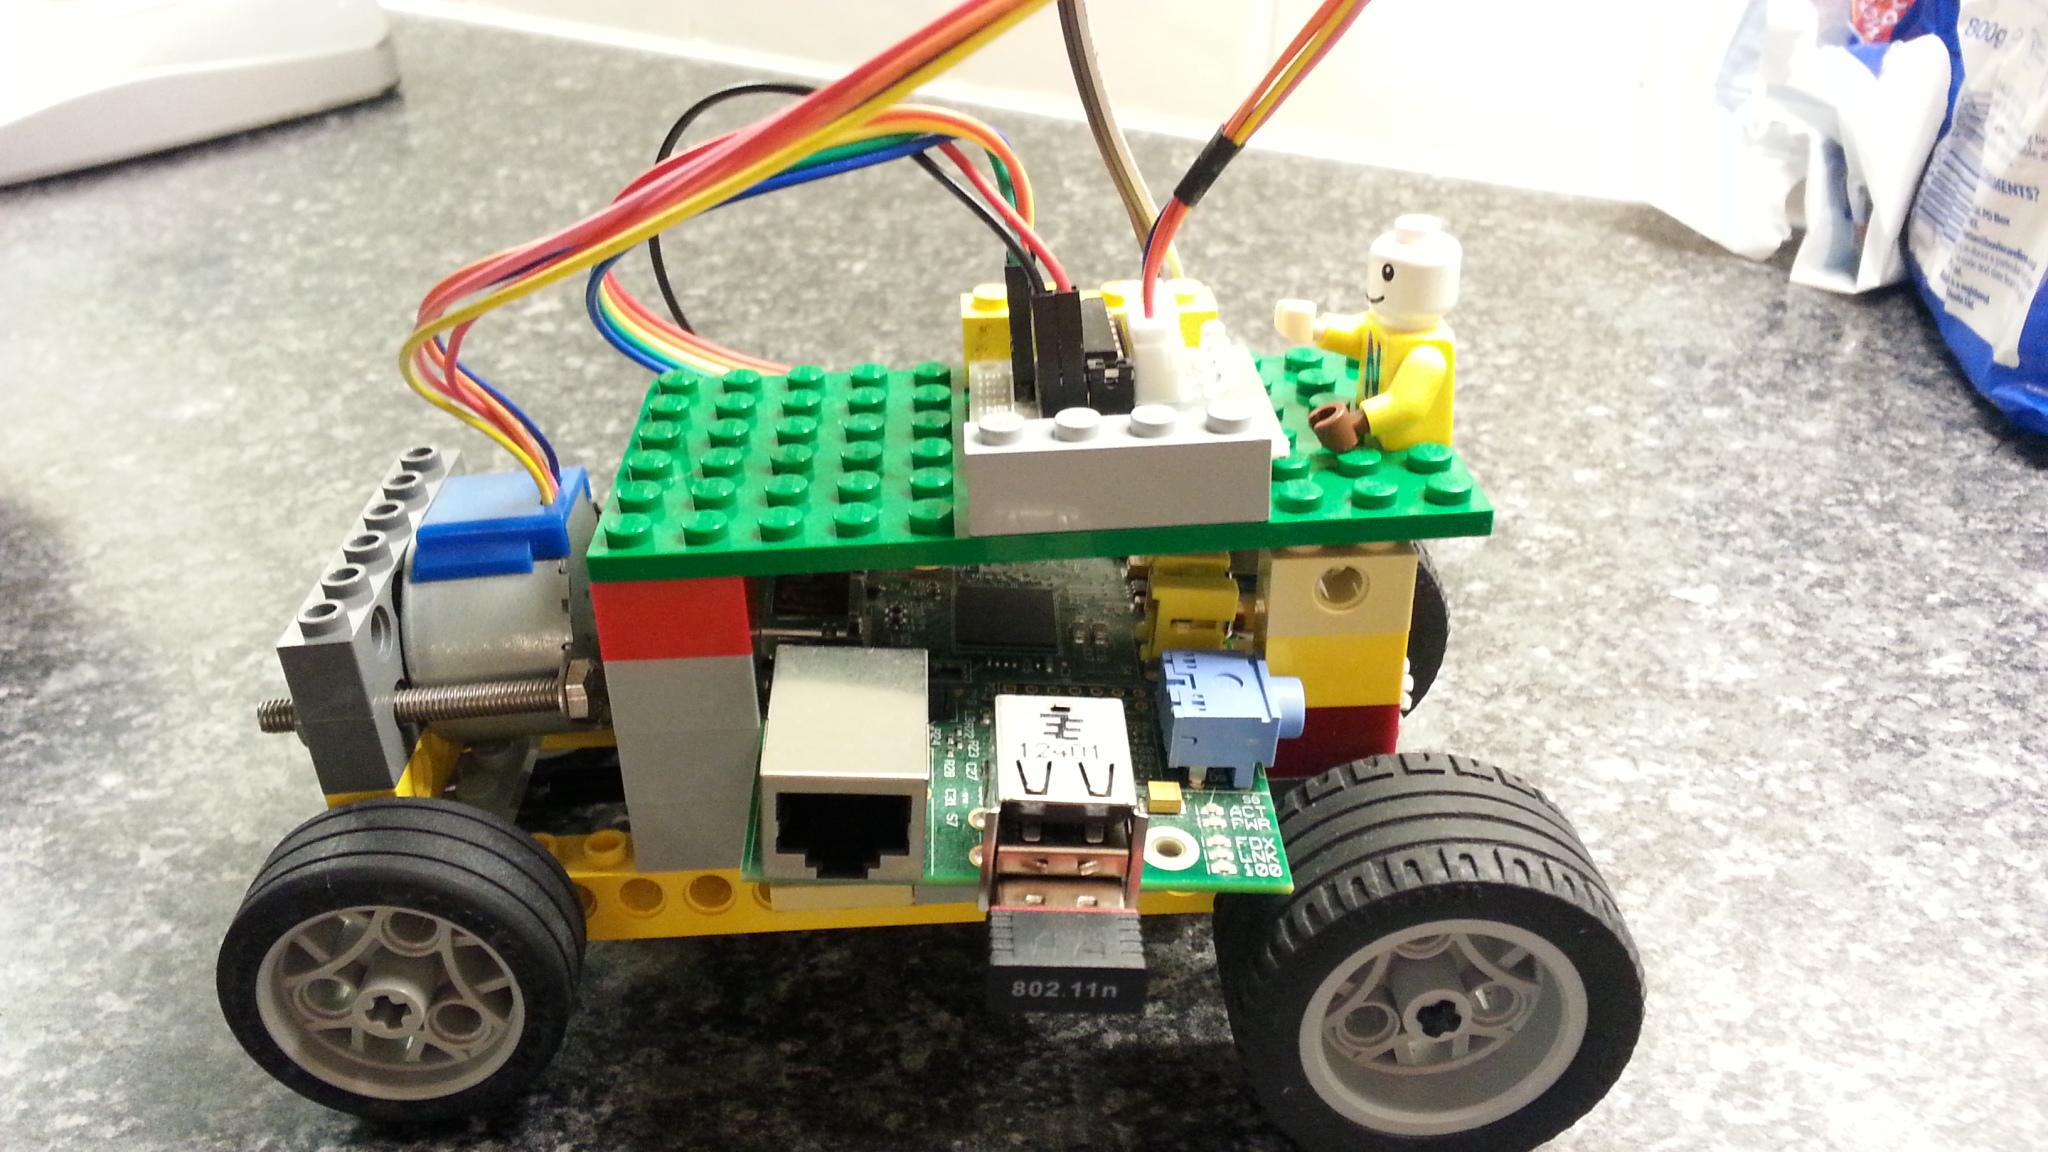
It's nearly time for the first Jersey Raspberry Jam and I'm taking along Thermobot. Thermobot Mk1 was taken apart for other projects so it was time to rebuild.

We have 3 HUGE tubs of lego, so it was pretty easy to source enough bits for a much better chassis:


check out the bolted stepper motor!
Then add the pi, thermometer and stepper controller board:


It took several goes and a nasty burning smell before I finally got all the wires in the right places, which is why I drew the above, so it's easier next time.

The code is the same as before. Except that I haven't bothered to get it to graph the data this time.

With the new gearing, the robot moves 6 cm per rotation, so 3 cm per °C


Monday, 5 October 2015

Tide Indicator Pi Project #5 - Parsing a months worth of tide data into different lists

Today I learned to use 

list.extend([item[1],item[2]])

to split the parsed tide data to different lists. :-)

full code below.


#A python program to import tide data from a portsofjersey website
#tidenow.py
#It pulls the data in from the tide site, a month at a time
#It looks for the class headers associated with date,time and height information
#and then creates lists of these data


import urllib2
from bs4 import BeautifulSoup
from time import sleep
import datetime as dt


#open site and grab html

rawhtml = urllib2.urlopen("http://www.ports.je/Pages/tides.aspx").read(40000)
soup = BeautifulSoup(rawhtml, "html.parser")


#get the tide data (it's all in 'td' tags)

rawtidedata = soup.findAll('td')


#get just the month and year (it's in the 1st 'h2' tag on the page)

rawmonthyear = soup.findAll('h2')[0].get_text()
print ('Month and Year: ', rawmonthyear)

#strip the html and parse it all to one big list

n=0
parsedtidedata=[]
for i in rawtidedata: 
   parsedtidedata.append(rawtidedata[n].get_text())
 # print (parsedtidedata[n]) #leave in for debugging for now
   n += 1


#create lists for each class of data

tidetimes=[]
tideheights=[]
tideday=[]


#extract data to each list (there are 10 data items for each day)

lastdayofmonth=int(parsedtidedata[-10])

for n in range(0,lastdayofmonth*10,10):

   tideday.append(parsedtidedata[n])
   tidetimes.extend([parsedtidedata[n+1],parsedtidedata[n+3],parsedtidedata[n+5],parsedtidedata[n+7]])
   tideheights.extend([parsedtidedata[n+2],parsedtidedata[n+4],parsedtidedata[n+6],parsedtidedata[n+8]])

print('data for the 1st of the month')
n=0
print tideday[n]
print tidetimes[n:n+4]
print tideheights[n:n+4] 

Sunday, 4 October 2015

Tide Indicator Pi Project #4 - Scraping a months worth of tide data in one hit

Having realised in my previous post I needed to move away from daily tide processing to collecting as data for a longer period, I chose this site to gather from, as the html code looked easy to scrape.

The code below is a starting point. I collects a month's worth of tide data, and parses it to one long list. I like this data better than the last site because 'empty' data slots are filled with '***' as a useful place-holder. The output is shown below.


#A python program to import tide data from a Ports of Jersey website
#tidenow.py
#It pulls the data in from the tide site, a month at a time

#import tweepy
#import smtplib
import urllib2
#import re
from bs4 import BeautifulSoup
from time import sleep
import datetime as dt


#open site and grab html

rawhtml = urllib2.urlopen("http://www.ports.je/Pages/tides.aspx").read(40000)
soup = BeautifulSoup(rawhtml, "html.parser")


#get the tide data (it's all in 'td'tags)

rawtidedata = soup.findAll('td')


#get just the month and year (it's in the 1st h2 tag on the page)

rawmonthyear = soup.findAll('h2')[0].get_text()
print ('Month and Year: ', rawmonthyear)

#parse it all to a list
n=0
parsedtidedata=[]
for i in rawtidedata: 
 parsedtidedata.append(rawtidedata[n].get_text())
 print (parsedtidedata[n])
 n += 1


Output:


Thursday, 1 October 2015

Tide Indicator Pi Project #3 - Success! and Complete Rethink Required

The next step in my plan to collect tide data from the web and use it to make some kind of live tide gauge.

Darn it, I thought I had it:


#tides for #jerseyci today, Thursday 1 October:
03:48 0.6m
09:21 11.7m
16:07 0.9m
21:42 11.5m
data from http://mbcurl.me/13KDW

I've been successfully scraping daily tide data, and posting it on my Pi-hosted site here...

jcwyatt.ddns.net

and tweeting it here...

www.twitter.com/#jerseyci

which was a major goal (code is below). Chron runs this Python program every morning at 5:30am.

However now it has come to thinking about calculating live tide heights I've hit a wall when trying to use the data I'm currently scraping.

I've been working on daily data, when what is needed is continuous data over a longer time. Once I have that I think I can calculate live tide height with a rolling algorithm. Tides don't fit in neat daily chunks.

I'm going back to here: http://www.ports.je/Pages/tides.aspx to scrape a month's worth of data at a time and see how it goes.

The code below took a while and is pretty untidy, but it does what it needs to do, with some nifty string and list handling that I'm quite proud of. 


#A python program to import tide data from a gov.je website
#tidescrape6.0.py - working fine
#It pulls the data in from the gov.je tide site, which is updated daily
#It looks for the class headers associated with date,time and height information
#and then creates a list of these bits of html

#this version(6.0) is called by a chrontab function and tweets at 5:30am everyday.

import tweepy
import smtplib
import urllib2
import re
from bs4 import BeautifulSoup
from time import sleep
import datetime as dt


#function to scrape tide data from website
def tidedatascrape():

 #open site
 rawhtml = urllib2.urlopen("http://www.gov.je/Weather/Pages/Tides.aspx").read(20000)

 soup = BeautifulSoup(rawhtml)

 #from http://stackoverflow.com/questions/14257717/python-beautifulsoup-wildcard-attribute-id-search

 #get the dates:
 tidedates = soup.findAll('td', {'class': re.compile('TidesDate.*')} )
 #get the times:
 tidetimes = soup.findAll('td', {'class': re.compile('TidesTime.*')} )
 #get the heights:
 tideheights = soup.findAll('td', {'class': re.compile('TidesHeight.*')} )

 #collect together the data for today

 todaysdate = tidedates[0].get_text()
 print (todaysdate)
 todaystimes = tidetimes[0].get_text()
 print (todaystimes)
 todaysheights = tideheights[0].get_text()
 print (todaysheights)


 #parse the times (always a 5 character string)
 ttime = [0,0,0,0]
 for i in range (0,4):
  ttime[i]=todaystimes[5*i:(5*i+5)]
  print ttime[i]


 #parse the heights (3 or 4 ch string delimited by 'm' e.g 2.5m3.4m etc)
 theight = ['','','','']
 list_index = 0
 for i in todaysheights:
  if i == 'm':
   list_index += 1
  else:
   theight[list_index] = theight[list_index] + i
 print theight[0]


 #create a tweetable string of all the data
 tweetstring = ('#tides for #jerseyci today, ' + todaysdate + ':\n')
 for i in range (0,4):
  tweetstring = tweetstring + (ttime[i] + ' ' + theight[i] + 'm\n')
 tweetstring = tweetstring + 'data from http://mbcurl.me/13KDW'
 print tweetstring
 return tweetstring
 

 #print len(tweetstring) #just to check it is within 140 characters

#function to write to a text file
def writetidestofile(tweetstring):
        with open('/var/www/dailytideoutput.txt','w') as f:
                f.write(str(tweetstring))
                f.close()


#function to tweet it
def tweettidedata(tweetstring):
 CONSUMER_KEY = '0000000000000000000'#keep the quotes, replace this with your consumer key
 CONSUMER_SECRET = '00000000000000000000000000000000000000'#keep the quotes, replace this with your consumer secret key
 ACCESS_KEY = '00000000000000000000000000000000000000'#keep the quotes, replace this with your access token
 ACCESS_SECRET = '00000000000000000000000000000000000000'#keep the quotes, replace this with your access token secret
 auth = tweepy.OAuthHandler(CONSUMER_KEY, CONSUMER_SECRET)
 auth.set_access_token(ACCESS_KEY, ACCESS_SECRET)
 api = tweepy.API(auth)

 api.update_status(status=tweetstring) #THIS LINE TWEETS! - LEAVE DEACTIVATED UNTIL READY


#email it(commented out for now)
'''
fromaddr = 'jbloggs@gmail.com'
toaddr  = 'j.bloggette@free.sch.uk'

# Credentials (if needed)
username = raw_input('gmail un: ')
password = raw_input('gmail pw: ')

# The actual mail send
server = smtplib.SMTP('smtp.gmail.com:587')
server.ehlo()
server.starttls()
server.login(username,password)
headers = "\r\n".join(["from: " + fromaddr,
                       "subject: " + 'Tides Today',
                       "to: " + toaddr,
                       "mime-version: 1.0",
                       "cont#ent-type: text/html"])

# body_of_email can be plaintext or html!                    
content = headers + "\r\n\r\n" + tweetstring
server.sendmail(fromaddr, toaddr, content)
server.quit
'''

#main prog
#collect data
tweetstring = tidedatascrape()
#output to file
writetidestofile(tweetstring)
#tweet data
tweettidedata(tweetstring) 


Sunday, 9 August 2015

Tide Indicator Pi Project #2 - Scraping the tidal data for St Helier

Tide Indicator Pi Project #2 - Scraping the tidal data for St Helier

Have working code that extracts the code and makes lists from it (with the html tags still attached for now):

#A python program to import tide data from a gov.je website
#tidescrape1.0.py - working fine
#It pulls the data in from the gov.je tide site, wkhich is updated daily
#It looks for the class headers associated with date,time and height information
#and then creates a list of these bits of html

#next step - try to extract just the data from current day and tweet it.

import urllib2
import re
from bs4 import BeautifulSoup


#open site
rawhtml = urllib2.urlopen("http://www.gov.je/Weather/Pages/Tides.aspx").read(20000)

soup = BeautifulSoup(rawhtml)

#from http://stackoverflow.com/questions/14257717/python-beautifulsoup-wildcard-attribute-id-search
#get the dates:
tidedates = soup.findAll('td', {'class': re.compile('TidesDate.*')} )

print (tidedates[0])

#get the times:
tidetimes = soup.findAll('td', {'class': re.compile('TidesTime.*')} )

print (tidetimes[0])

#get the heights:
tideheights = soup.findAll('td', {'class': re.compile('TidesHeight.*')} )

print (tideheights[0])

Output looks like this:

<td class="TidesDate Weekend">Sunday 9 August</td>
<td class="TidesTime Weekend"><span style="color:#cc0000;">01:57</span><br/>08:42<br/>14:33<br/>21:27<br/></td>
<td class="TidesHeight Weekend"><span style="color:#cc0000;">8.5m</span><br/>3.6m<br/>8.4m<br/>3.7m<br/></td>


Next step is to somehow strip the text out.

Monday, 27 July 2015

Tide Indicator Pi Project #1 - Scraping the tidal data for St Helier - Update

A quick update to post 1 on this project.

This is the data from the Jerseymet site and it looks like it is indexed well and the required data sits in nice blocks.


Sunday, 26 July 2015

Tide Indicator Pi Project #1 - Scraping the tidal data for St Helier

I have a plan to build a live tide indicator. This will lift tide data from the web, interpret and extrapolate it to work out the current tide height, and then output this data live to the web and a physical indicator. 

This is the data on the UK Hydrographic Office site:


(http://www.ukho.gov.uk/easytide/EasyTide/ShowPrediction.aspx?PortID=1605&PredictionLength=7)


and here's the html to scrape:


Tidal info is also avalable here: http://www.portofjersey.je/Pages/tides.aspx


and here*: http://www.gov.je/Weather/Pages/Tides.aspx

*Of these it actually looks like this last one has the neatest, most 'scrapable' formatting and the current days tides will always be at the same position on the page.


To scrape the data I initially tried this: 

#python program to import tide data from a website
import urllib2

#open site
rawhtml = urllib2.urlopen("http://www.ukho.gov.uk/easytide/EasyTide/ShowPrediction.aspx?PortID=1605&PredictionLength=7").read(20000)

print (rawhtml)

Which collected the text from the site, but it appeared tricky to extract the meaningful data.

I googled and found this: http://docs.python-guide.org/en/latest/scenarios/scrape/

But it wasn't to easy to install the lxml module using pip but this worked:

sudo apt-get install python-lxml

Next job is to learn how to extract particular bits of data.

Sunday, 14 June 2015

Being a 21st Century Teacher

I LOVE being a 21st century teacher! 

By most measures, teaching in general, and teaching computing in particular, is easier and more fun than ever before. A bold statement perhaps?  For me, the way technology facilitates community is key.

For starters, social media allows me to join a great club of fellow professionals. Entry criteria: a twitter account and a willingness to learn and share.

With the advent of resource-sharing sites like TES and primaryresources.co.uk, not to mention our own site, there really is no excuse for poorly planned, boring lessons.

If I get stuck and need to learn something new myself, well, just like Neo in the Matrix you can get on Youtube and learn just about anything (it can take a bit longer than it did for Keanu). For example I learned lots of Kodu tricks from @GeekyNicki and returned the favour with some Kodu and Flowol tutorials of my own.

In a typical day I can wake up to inspirational tweets from the likes of @urban_teacher@markbarnes19 and @ICTEvangelist. I can teach lessons from plans I've found and adapted from CAS, TES or computing super heroes like Simon Haughton, and in the evening I can study Computer Science at MIT.

I can't imagine, now, not being able to connect quickly and easily with the best educators in my chosen field.

Teaching from just your own experience, behind a closed door, from a book? 

That's so 20th century, darling!


Thursday, 16 April 2015

Pi-based Domestic Electricity Monitor - Part 7 - Project stalled indefinitely.

For now this project has been halted while I work on other things to develop my skills further, especially with databases and web publishing.

Eventually I hope to buy a cheap model A Pi and get this project up and running again.


Thermobot Update

Video of Bot in operation.


The thermobot also stores and plots 24 hours of data. It's finished its job now, but was logging live every minute to a webpage. You can see its results from my conservatory for 16th April 2015 here:

http://jcwyatt.ddns.net/thermobot.html

Initially, pyplot was producing a wierd colouring-in effect under the graph, but adding   

plt.clf()
 
to reset pyplot after each plot fixed the problem. I discovered this accidentally.

the updated code to include the data logging and plotting is here:


import RPi.GPIO as GPIO
import time
import matplotlib
matplotlib.use('agg')
import os
import matplotlib.pyplot as plt


#pseudo code:
#   fill a list with 60 zeros
# set the t1_temp variable to 18 deg c
# every minute:
# get the t2_temperature from the chip
# ext:write the temperature to a list or database
# calc the temperatures difference from previous value
# move the bot an amount relative to the temp difference

#initialise bot settings (stepper motor))
GPIO.setmode(GPIO.BCM)
 
enable_pin = 18
coil_A_1_pin = 7
coil_A_2_pin = 8
coil_B_1_pin = 23
coil_B_2_pin = 24
 
GPIO.setup(enable_pin, GPIO.OUT)
GPIO.setup(coil_A_1_pin, GPIO.OUT)
GPIO.setup(coil_A_2_pin, GPIO.OUT)
GPIO.setup(coil_B_1_pin, GPIO.OUT)
GPIO.setup(coil_B_2_pin, GPIO.OUT)
 
GPIO.output(enable_pin, 1)
 
delay = 2

def forward(delay, steps):
 for i in range(0, steps):
  setStep(1, 0, 1, 0)
  time.sleep(delay)
  setStep(0, 1, 1, 0)
  time.sleep(delay)
  setStep(0, 1, 0, 1)
  time.sleep(delay)
  setStep(1, 0, 0, 1)
  time.sleep(delay)
 
def backwards(delay, steps):
 for i in range(0, steps):
  setStep(1, 0, 0, 1)
  time.sleep(delay)
  setStep(0, 1, 0, 1)
  time.sleep(delay)
  setStep(0, 1, 1, 0)
  time.sleep(delay)
  setStep(1, 0, 1, 0)
  time.sleep(delay)
 
def setStep(w1, w2, w3, w4):
 GPIO.output(coil_A_1_pin, w1)
 GPIO.output(coil_A_2_pin, w2)
 GPIO.output(coil_B_1_pin, w3)
 GPIO.output(coil_B_2_pin, w4)

#from http://www.modmypi.com/blog/ds18b20-one-wire-digital-temperature-sensor-and-the-raspberry-pi:
#load drivers for temperature probe
os.system('modprobe w1-gpio')
os.system('modprobe w1-therm')

temp_sensor = '/sys/bus/w1/devices/28-0414607111ff/w1_slave'

#Get the raw data from the sensor:
def temp_raw():

 f = open(temp_sensor, 'r')
 lines = f.readlines()
 f.close()
 return lines

def read_temp():

 lines = temp_raw()
 while lines[0].strip()[-3:] != 'YES':
  time.sleep(0.2)
  lines = temp_raw()
        
 temp_output = lines[1].find('t=')

 if temp_output != -1:
  temp_string = lines[1].strip()[temp_output+2:]
  temp_c = float(temp_string) / 1000.0
  return temp_c

#initialise current temperature
currentTemp = 14.00

#make an empty list for 24 hours worth of data
tempLog = [0] * (60*24)

#run the bot
while True:
  oldTemp = currentTemp
  currentTemp = read_temp()
  tempDiff = currentTemp - oldTemp
  if tempDiff >= 0:
   steps = tempDiff * 256
   forward(int(delay) / 1000.0, int(steps)) 
  else:
   steps = tempDiff * -256
   backwards(int(delay) / 1000.0, int(steps))
  setStep(0,0,0,0)

#now do the graph stuff:
#add the new reading to the end of the list 

  tempLog.append(currentTemp)

#delete the first item in the list

  del tempLog[0]

#plot the graph as an image    
  
  plt.plot(tempLog)
  plt.ylabel ('Bedroom Temperature (deg C)')
  plt.xlabel ('Time (minutes) (Full width = 24hrs)')
  plt.savefig('/var/www/images/tempLog.png')
  plt.clf()

  hrlog=(tempLog[-60:]) 
  plt.plot(hrlog)
  plt.ylabel ('Temp (deg C)')
  plt.xlabel ('Time (minutes) last hour')
  plt.savefig('/var/www/images/tempLog60.png')
  plt.clf()

  time.sleep(60)
 

Pi Science Project: Tank Power - Part 1 - Outline of project

New Project: Tank Power

Aim:

To establish whether, in the summer, I should heat my hot water tank using electricity via the immersion heater or use gas via the central heating boiler. 

Hypothesis: Electricity is a more efficient way to heat the water in the tank because when using gas, there is heat loss via the pipes transporting the heat from the boiler to the tank and also heat lost from the boiler flue pipe.


Proposed Method:

Use Raspberry Pi and temperature sensor to log the temperature of the tank by fitting the sensor to the outside of the tank. Record the value every 2 minutes. By looking for when the temperature is rising, the length of time for which energy is being supplied to the tank each day can be measured. 

For gas heating, if the quantity of gas used during the same 24hr period is known, the energy consumption can be calculated. 

For electrical heating, if the power consumption of the the heater is known then the energy consumption can be calculated.

Other factors should be revealed, for example the rate of heating for gas compared to electricity and how well the thermostats work at regulating the temperature.

Step 1: Rig up the pi logging the temperature of the tank with the sensor taped to the outside to gather preliminary data. 

draft pseudo code:

#import sqlite to write the temperature and time data to a file
#import matplotlib to write the data  to graphs
#import OS  to access the temperature sensor

#if it doesn't exist create the database
#open the database

#read the current temperature and time

#write time and temp to the end of db

#get the data from the db (how much?)

#1) last 24 hours
#2) last 6 hours
#3) last 3 hours

#plot each graph to a .png for showing on a database

#data analysis extension:
#import last 24 hours data (midnight to midnight)
#read temperature values
#if temperature is rising start the timer
#if temperature is falling stop the timer
#might need to average these values out to allow for small fluctuations
#add the timer value to total 'on' time
#return a value for total time of rising temperature in 24 hrs
#calculate the theoretical value of energy used vs actual?
#for electrical this is easier done by the program if the power rating of the heater is known
#for gas would need to input the meter reading for the 24hour period and do some calcs.


Monday, 30 March 2015

Thermo-Bot Project


In this post, I describe how I took a stepper motor, some Lego(R) and a temperature probe to make a temperature sensitive robot. Basically it's a Pi-on-wheels that moves to the correct position on a temperature scale to indicate the current room temperature. Don't ask why I thought this was a good idea, but I'm quite proud that it works!


Video of it working here (time lapse of 50 minutes) https://youtu.be/bbkwAPPF_vY


I bought a stepper motor with a view to making some kind of robot.

This tutorial from Simon Monk on the Adafruit site is all you need for Pi-controlled stepper motors:

https://learn.adafruit.com/adafruits-raspberry-pi-lesson-10-stepper-motors

I bought my stepper motor from ebay with the controller chip included on a board with some LEDs, which were really helpful in debugging, since the wires in the Adafruit diagram don't 'line up' obviously with the Pi GPIO pins. My motor would only go forwards until I followed the diagram MUCH more carefully. (The fault was with me not Simon's diagram.)

I also did some work with the single wire temperature sensor, again using the Adafruit tutorial from Simon Monk:

https://learn.adafruit.com/adafruits-raspberry-pi-lesson-11-ds18b20-temperature-sensing

Although some of the Python code came from here:

http://www.modmypi.com/blog/ds18b20-one-wire-digital-temperature-sensor-and-the-raspberry-pi:


However, this time it wasn't my fault when it didn't work. With model B+ Pis you have to add this to the /boot/config.txt file:

dtoverlay=w1-gpio,gpiopin=4

Once this was in place the sensor worked fine.

The robot is cobbled together really quickly (badly) using lego. Initial belt-drive version had problems with the elastic-band drive belt jumping off the drive wheel, so direct drive was used instead.

Then it was time to combine the two tutorials and with a few extra lines of code I have a robot that moves up and down a temperature scale according to the current room temperature.


Here's the code I used. You'll notice most of it is pretty much left as per the Adafruit example and the modmypi link above, so credit to Simon Monk and the ModMyPi guru.


import RPi.GPIO as GPIO
import time
import os

#initialise bot settings (stepper motor))
GPIO.setmode(GPIO.BCM)
 
enable_pin = 18
coil_A_1_pin = 7
coil_A_2_pin = 8
coil_B_1_pin = 23
coil_B_2_pin = 24
 
GPIO.setup(enable_pin, GPIO.OUT)
GPIO.setup(coil_A_1_pin, GPIO.OUT)
GPIO.setup(coil_A_2_pin, GPIO.OUT)
GPIO.setup(coil_B_1_pin, GPIO.OUT)
GPIO.setup(coil_B_2_pin, GPIO.OUT)
 
GPIO.output(enable_pin, 1)
 
delay = 2

def forward(delay, steps):
 for i in range(0, steps):
  setStep(1, 0, 1, 0)
  time.sleep(delay)
  setStep(0, 1, 1, 0)
  time.sleep(delay)
  setStep(0, 1, 0, 1)
  time.sleep(delay)
  setStep(1, 0, 0, 1)
  time.sleep(delay)
 
def backwards(delay, steps):
 for i in range(0, steps):
  setStep(1, 0, 0, 1)
  time.sleep(delay)
  setStep(0, 1, 0, 1)
  time.sleep(delay)
  setStep(0, 1, 1, 0)
  time.sleep(delay)
  setStep(1, 0, 1, 0)
  time.sleep(delay)
 
def setStep(w1, w2, w3, w4):
 GPIO.output(coil_A_1_pin, w1)
 GPIO.output(coil_A_2_pin, w2)
 GPIO.output(coil_B_1_pin, w3)
 GPIO.output(coil_B_2_pin, w4)

#from http://www.modmypi.com/blog/ds18b20-one-wire-digital-temperature-sensor-and-the-raspberry-pi:
#load drivers for temperature probe
os.system('modprobe w1-gpio')
os.system('modprobe w1-therm')

temp_sensor = '/sys/bus/w1/devices/28-0414607111ff/w1_slave'

#Get the raw data from the sensor:

def temp_raw():

 f = open(temp_sensor, 'r')
 lines = f.readlines()
 f.close()
 return lines

def read_temp():

 lines = temp_raw()
 while lines[0].strip()[-3:] != 'YES':
  time.sleep(0.2)
  lines = temp_raw()
        
 temp_output = lines[1].find('t=')

 if temp_output != -1:
  temp_string = lines[1].strip()[temp_output+2:]
  temp_c = float(temp_string) / 1000.0
  return temp_c

#initialise current temperature start value (and place bot on 14 deg C mark before running)
currentTemp = 14.00


#run the bot
while True:
  oldTemp = currentTemp
  currentTemp = read_temp()
  tempDiff = currentTemp - oldTemp
  print (oldTemp, currentTemp, tempDiff,)
  if tempDiff >= 0:
   steps = tempDiff * 256
   forward(int(delay) / 1000.0, int(steps)) 
  else:
   steps = tempDiff * -256
   backwards(int(delay) / 1000.0, int(steps))
  setStep(0,0,0,0)
  time.sleep(60)
  
 
It works!

Tuesday, 10 March 2015

Pi-based Domestic Electricity Monitor - Part 6 - First Log - Success and Failure

Summary:

I logged 24hrs of data from my domestic electricity meter, but discovered that writing each event to the db with SQlite seemed to be taking 4 seconds, making the program as it stands no good for logging an event which can happen more than twice a second on occasions of high consumption. Values below 1kW were recorded accurately I believe.

To run the program via SSH I used nohup for the first time so that it would run even once I closed the session...and then had to learn how to find and kill said program:

To hunt running program: 

$ ps -e | grep python


To kill running program:

$ sudo kill 3861


Detail:

I used the program below to log the meter for around 24 hrs

(House averages 1kW, or 800 flashes per hour. 24hrs is therefore around 20,000 flashes)

This was to test the logging process and to see the size of the data file that would be created.

However, on analysing the data I soon noticed the data was suspect:
a) not enough readings for 24hrs (~9000, rather than ~20,000)
b) readings which never go above around 1kW:


(graph created in Libre office after exporting data from sqlite. This site was helpful here: http://www.sqlite.org/cli.html)


 Here's a sample of the data: (Time|Consumption|Meter Reading)

Tue Mar 10 07:23:49 2015|0.980246908963771|16791
Tue Mar 10 07:23:54 2015|0.939329897684513|16791
Tue Mar 10 07:23:58 2015|0.978048032653337|16791
Tue Mar 10 07:24:03 2015|0.977999583707987|16791
Tue Mar 10 07:24:08 2015|0.959483188529128|16791
Tue Mar 10 07:24:12 2015|0.955398819345674|16791
Tue Mar 10 07:24:17 2015|0.97396251715844|16791


Every interval is around 4 seconds and 1kW at a time when it should be well above this.

When I remove the lines that write the data to the db, the consumption data becomes correct, so I think that writing the data to the db is taking around 4 seconds.

The size of the data file is not going to be a problem: ~9000 readings is ~500kB.

Here's the code I used:

It features a facility for calculating the meter reading based on initial values and 800 flashes of the LED being 1kWh.


#!/usr/bin/env python
     
#First go at logging data from the meter

import RPi.GPIO as GPIO, time, os
import sqlite3


#initiaise database tools
conn = sqlite3.connect('elecmeter.db')
c =  conn.cursor()

#create database
#what to send to db: ascitime, power consuption, meter reading
c.execute("CREATE TABLE e_meterlog01 (time float, power float, meter_reading integer)")

#initialise pins     
DEBUG = 1
GPIO.setmode(GPIO.BCM)
GPIO.setup(23, GPIO.IN, pull_up_down=GPIO.PUD_DOWN)


#procedure to wait for LED flash front edge
def wait_for_flash():
    try:
        GPIO.wait_for_edge(23,GPIO.RISING)
    except KeyboardInterrupt:
        GPIO.cleanup()       # clean up GPIO on CTRL+C exit 
        conn.close() 
 
#initialise meter reading tools 
meter_rdg = 16777
impulse_count=0

#timing and kW calcs based on 800 imp / kWh:
 
start_time=time.time()

for i in range (0,22000):
    wait_for_flash()
    elapsed_time = time.time()-start_time
    start_time=time.time() 
 
#increment the meter reading every 800 pulses:
 
    if impulse_count < 800:
        impulse_count += 1
    else:
        meter_rdg +=1
        impulse_count=0 
 
    kW=((1/elapsed_time)*4.5) 
 
    print (elapsed_time,kW,meter_rdg,impulse_count)
    c.execute("INSERT into e_meterlog01 VALUES(?,?,?)",(time.asctime(),kW,meter_rdg))
    conn.commit()
    time.sleep(0.3) #to allow for LED to turn off
    
GPIO.cleanup()           # clean up GPIO on normal exit        
conn.close()

print("Ending Program")


Saturday, 7 March 2015

Remote accessing a Raspberry Pi

Just a few tweeks to the pi to make it easier to work on it remotely:

1) Autostart the VNC server - https://learn.adafruit.com/adafruit-raspberry-pi-lesson-7-remote-control-with-vnc/running-vncserver-at-startup (EDIT - I had to turn this off. After the first time of working, thereafter the remote screen was just grey with an 'x' mouse pointer. Starting manually works fine)

2) Get LAMP installed to allow remote access: http://elinux.org/RPi_A_Simple_Wheezy_LAMP_install

3) Install and get no-ip working -http://www.noip.com/support/knowledgebase/installing-the-linux-dynamic-update-client/

It all works: http://jcwyatt.ddns.net

However I installed no-ip using some other instructions, which I won't link to, which put the noip client in the home directory, which I think is why I can't start noip the same way as I start TightVNC. It needs root privileges to run noip now, and I don't think it should if you install it properly.

(EDIT - My mobile network provider is blocking access to this site, but I can access it from everywhere else I've tried. Will try changing the re-direct settings on my router and the no-ip settings.)


Next task is writing the data continually to a sqlite db for 24 hours, to gauge the file size.

Tuesday, 24 February 2015

Pi-based Domestic Electricity Monitor - Part 5 - 'Connecting' the LDR + RPi to the meter

In this post, I've connected the Raspberry Pi to the electricity meter and created a python program to work out the consumption rate:

With the Raspberry Pi and the LDR sensor able to detect changes in light levels, it was time to 'connect' the LDR to the electricity meter's LED. Since I've read that you are not permitted to tamper with the meter at all, this consisted of taping the LDR to the front of the meter with insulating tape. (Image to follow). Should hold long-term, but easy to remove.

The meter's LED flashes 800 times for 1 kWh. From the interval between flashes, the instantaneous rate of consumption can be calculated. I made it (1/interval x 4.5). See working out below.


I made a few errors along the way, by waiting for the LED to go off but not factoring in this wait time, and messing up my maths the first time round.

Here's the output. The first colomn is the interval between flashes in seconds, the second is the power consumption in kW:


That's if my code is correct:


#!/usr/bin/env python

#First go with the LDR picking up the flashes from the electrcity meter.

import RPi.GPIO as GPIO, time, os

#procedure to wait for LED flash front edge
def wait_for_flash():
    try:
        GPIO.wait_for_edge(23,GPIO.RISING)
    except KeyboardInterrupt:
        GPIO.cleanup()       # clean up GPIO on CTRL+C exit 

#initialise pins     
DEBUG = 1
GPIO.setmode(GPIO.BCM)
GPIO.setup(23, GPIO.IN, pull_up_down=GPIO.PUD_DOWN)


#timing and kW calcs based on 800 imp / kWh

start_time=time.time()

for i in range (0,20):
    wait_for_flash()
    elapsed_time = time.time()-start_time
    start_time=time.time()
    kW=((1/elapsed_time)*4.5)
    print (elapsed_time,kW)
    time.sleep(0.3) #to allow for LED to turn off

GPIO.cleanup()           # clean up GPIO on normal exit        

print("Ending PRogram")


The next steps are to write values to a database with SQLite:
current consumption rate to 3 d.p., date and time, calculated meter reading as a check of accuracy against actual meter reading.

Then I would like to have a new program to process and analyse the data.


Monday, 23 February 2015

Debugging a lesson on Debugging - Mobile Mistakes #1

iPads are wonderful devices. No really, they are. Even if they make you start a sentence without a capital letter.

This post however, is about what can go wrong in an IT lesson using mobile devices and the lessons learned.

I am working with a school that has amazing IT provision, with one-to-one across the board: iPads in LKS2 and Macbooks in UKS2, plus a suite of networked machines. I have occasional use of an iPad, so I borrowed one with 'Hopscotch' installed, to plan my Computer Science lesson on debugging for a year 3 class.

I put together what I hoped was a well-structured plan for making a tilting 'etch-a-sketch' game, with debugging being the focus, but with some cross-curricular maths work on angles included.

However, what I did not plan for was that within the class set of iPads, two different versions of hopscotch were installed, neither of which were the same as the one I had used to plan with!

You would not think that this would be so significant for something as simple as a tilting 'etch-a-sketch' game. However, what if one version of Hopscotch required using angles to set the direction of motion of the sprite, and the other used +ve and -ve co-ordinates for the same task? Some advice: don't try teaching angles to 360° and cartesian co-ordinates and negative numbers to 2 sections of a Year 3 class simultaneously. It doesn't go well.

Despite this, and the fact that it was the last hour of the last day of half term, and that there'd been a cake sale immediately prior to the lesson, the children were great. Most of the 'angle' children succeeded, and some of the x-y group got something working. But was it a great lesson on debugging? Only for me.

Lessons learned:

  • Check all the mobile devices you are going to use have the software you want installed.
  • Check it is the same version on all devices.
  • Plan your lesson using the same device the children will use (or at least the same software)


Saturday, 21 February 2015

Pi-based Domestic Electricity Monitor - Part 4 - Timing intervals between flashes of the LED

The next stage in developing the electricity monitor, using the flashing LED on my domestic meter and an LDR connected to the PI, is to try to detect when the LED is on / off and log the time between flashes.

Hardware changes:

Instead of using an RC circuit, I swapped the capacitor for a 1kΩ resistor, as I am no longer interested in the analogue light level, just whether a light input is on or off. (Diag. to follow once I get Fritzing working!) [edit - Fritzing is cool]


I also added a mini voltmeter I've had kicking around for ages from a previous project, so that I could see what was happening to the voltage level on pin 23 for debugging.

Software

This was very helpful: http://raspi.tv/2013/how-to-use-interrupts-with-python-on-the-raspberry-pi-and-rpi-gpio

I had an 'unusual' set up for testing, in that I was having a lie-in on a Saturday morning. I could control the blinds in my room from the bed, and that was enough to set Pin 23 high or low.

here's the code and output. It still needs a few tweaks but it works well enough for testing. Next job is to rebuild the hardware and attach it to the electricity meter.


#!/usr/bin/env python
     
# Example for edge sensing on pin 23 using a LDR and Resistor in series

#thanks to Alex Eames @ http://raspi.tv for the useful hints

#Outline:
#1)set pin low
#2)wait for falling edge
#3)start timer
#4)Wait for next falling edge
#5)stop timer and log or print time since last event
#6)reset and restart timer
#7) repeat
     
import RPi.GPIO as GPIO, time, os

#procedure to wait for transit light-->dark: 
 
def wait_for_dark():
    try:
        GPIO.wait_for_edge(23,GPIO.FALLING)    
    except KeyboardInterrupt:
        GPIO.cleanup()       # clean up GPIO on CTRL+C exit 

#initialise pins:     
DEBUG = 1
GPIO.setmode(GPIO.BCM)
GPIO.setup(23, GPIO.IN, pull_up_down=GPIO.PUD_DOWN)


wait_for_dark()

#timing
for i in range (0,5):
    start_time =time.time()
    wait_for_dark()
    elapsed_time = time.time()-start_time
    print (GPIO.input(23),elapsed_time)
    time.sleep(2)

GPIO.cleanup()           # clean up GPIO on normal exit        

print("Ending PRogram")  

Monday, 16 February 2015

Pi-based Domestic Electricity Monitor - Part 3 - Writing data to a file

Warning! This post is just my rough notes as I learn how to do this, so I can find the info again. It may not be as cohesive as I would like, in the short term. I'll tidy it up when I'm done, honest I will.  

Now I can collect the data from the light sensor, I need to be able to write it to a database file.

Looking around, SQLite would seem to be a good choice for this. It's lighter weight than MySQL and, I hope, easier to work with. Also, it's recommended for local file hosting, and since the data will always live on the Pi, that's OK.

I wasted too much time trying to install SQLite, before I discovered ITS ALREADY INCLUDED WITH PYTHON!

I think I'll be needing some help with using it, so here's a tutorial or two I'll use

https://docs.python.org/3/library/sqlite3.html

http://www.tutorialspoint.com/sqlite/sqlite_installation.htm


Time-handling info:

https://docs.python.org/3/library/time.html


Before I start using the light sensor to detect the little flashing light on my electricity meter, I want to test writing to a database with live light level data. Which I'm off to try next...

(Later that same day...)

...I captured sunset light levels tonight! (My daughters went into the room to watch TV though, and turned the lights on). Actual sunset is listed as 5:31pm.


The chart was made by copying and pasting the raw text data from the screen to LibreOffice Calc and post-processing it, so that it went down and not up as the sun went down. Raw values for 'light level' went from about 1000 (bright) to 700,000(dark) as the capacitor took longer to charge in the dark.

 Here's the code I used:

#!/usr/bin/env python
     
# Example for RC timing reading for Raspberry Pi
     
import RPi.GPIO as GPIO, time, os
import sqlite3

#initiaise database tools
conn = sqlite3.connect('lightlevels.db')
c =  conn.cursor()

#create database
#c.execute("CREATE TABLE lightlevel (data text, level integer)")


#read light level from GPIO
DEBUG = 1
GPIO.setmode(GPIO.BCM)
  
def RCtime (RCpin):
    reading = 0
    GPIO.setup(RCpin, GPIO.OUT)
    GPIO.output(RCpin, GPIO.LOW)
    time.sleep(0.1)
     
    GPIO.setup(RCpin, GPIO.IN)
    # This takes about 1 millisecond per loop cycle
    while (GPIO.input(RCpin) == GPIO.LOW):
        reading += 1
    return reading
     
for i in range (0,90):
    lilev= (RCtime(23)) # Read RC timing using pin #23
    print (lilev) 
    print (time.asctime())
    c.execute("INSERT into lightlevel VALUES(?,?)",(time.asctime(),lilev))
    conn.commit()
    time.sleep(60)

conn.close()


Not a bad day's work play.

Next up, logging flashes of a LED, and converting the interval to a kW consumption value.


PS
I found these commands here which could be very useful later:


  • gpio wfi <pin> rising/falling/both
This causes GPIO to perform a non-busy wait on a single GPIO pin until it changes state to that indicated.


  • gpio edge <pin> rising/falling/both/none
This enables the given pin for edge interrupt triggering on the rising, falling or both edges. (Or none which disables it)

Thursday, 12 February 2015

Pi-based Domestic Electricity Monitor - Part 2 - Programming the Light Sensor


It works! Here's the program (see below) running on the Pi:


This is a very useful link:

http://www.raspberrypi-spy.co.uk/2012/08/reading-analogue-sensors-with-one-gpio-pin/

as is this:

https://learn.adafruit.com/basic-resistor-sensor-reading-on-raspberry-pi/basic-photocell-reading

If you just want the code:

  1. #!/usr/bin/env python
  2.  
  3. # Example for RC timing reading for Raspberry Pi
  4. # Must be used with GPIO 0.3.1a or later - earlier verions
  5. # are not fast enough!
  6.  
  7. import RPi.GPIO as GPIO, time, os
  8.  
  9. DEBUG = 1
  10. GPIO.setmode(GPIO.BCM)
  11.  
  12. def RCtime (RCpin):
  13. reading = 0
  14. GPIO.setup(RCpin, GPIO.OUT)
  15. GPIO.output(RCpin, GPIO.LOW)
  16. time.sleep(0.1)
  17.  
  18. GPIO.setup(RCpin, GPIO.IN)
  19. # This takes about 1 millisecond per loop cycle
  20. while (GPIO.input(RCpin) == GPIO.LOW):
  21. reading += 1
  22. return reading
  23.  
  24. while True:
  25. print RCtime(18) # Read RC timing using pin #1
or

#!/usr/local/bin/python

# Reading an analogue sensor with
# a single GPIO pin

# Author : Matt Hawkins
# Distribution : Raspbian
# Python : 2.7
# GPIO   : RPi.GPIO v3.1.0a

import RPi.GPIO as GPIO, time

# Tell the GPIO library to use
# Broadcom GPIO references
GPIO.setmode(GPIO.BCM)

# Define function to measure charge time
def RCtime (PiPin):
  measurement = 0
  # Discharge capacitor
  GPIO.setup(PiPin, GPIO.OUT)
  GPIO.output(PiPin, GPIO.LOW)
  time.sleep(0.1)

  GPIO.setup(PiPin, GPIO.IN)
  # Count loops until voltage across
  # capacitor reads high on GPIO
  while (GPIO.input(PiPin) == GPIO.LOW):
    measurement += 1

  return measurement

# Main program loop
while True:
  print RCtime(4) # Measure timing using GPIO4